Outdoor Services Crew

Wednesday, November 28, 2012

Looking Back Part 2


I received a lot of feed back on a post I did last year called Looking Back .  Many people ask for another one with more pictures of the past and present, so without many words, here is part 2. Also in case you didn't know you can click on the pictures for a larger view. This is true of any picture posted on this blog.


Ryan

Thursday, October 25, 2012

Turfgaurd Sensors

Over the past few years a new tool has come around for the Turf Industry and after letting things mature a bit I have moved forward in deploying this technology here at CU. It is called Turfgaurd and is a soil moisture, temperature, and salinity monitoring tool that will help us monitor the soil profile directly. The system is wireless and uses the backbone of our current Network 8000 Central control system.

There are two pieces to the system, one is the soil probe itself that is inserted into the ground and the other is a small radio transceiver that is mounted inside our current VP controlers and draws power from the controller for operation. There is a small base station in the Turf Office that receives the signal and is viewed through the Sitevision software on the computer in the office. The main display screen, seen above, shows a quick overview of the readings of each of the sensors. Currently we have 9 sensors deployed in locations throughout campus. The main display screen shows soil moisture (top) soil temperature (middle) and the soil salinity(bottom) in a easy to see quick glance.

The soil sensors themselves are self contained and have a battery life of about 3 years. They have an in-ground range of about 500' to reach a transceiver. There are 6 probes on each sensor, 3 on top and 3 probes 5" below.

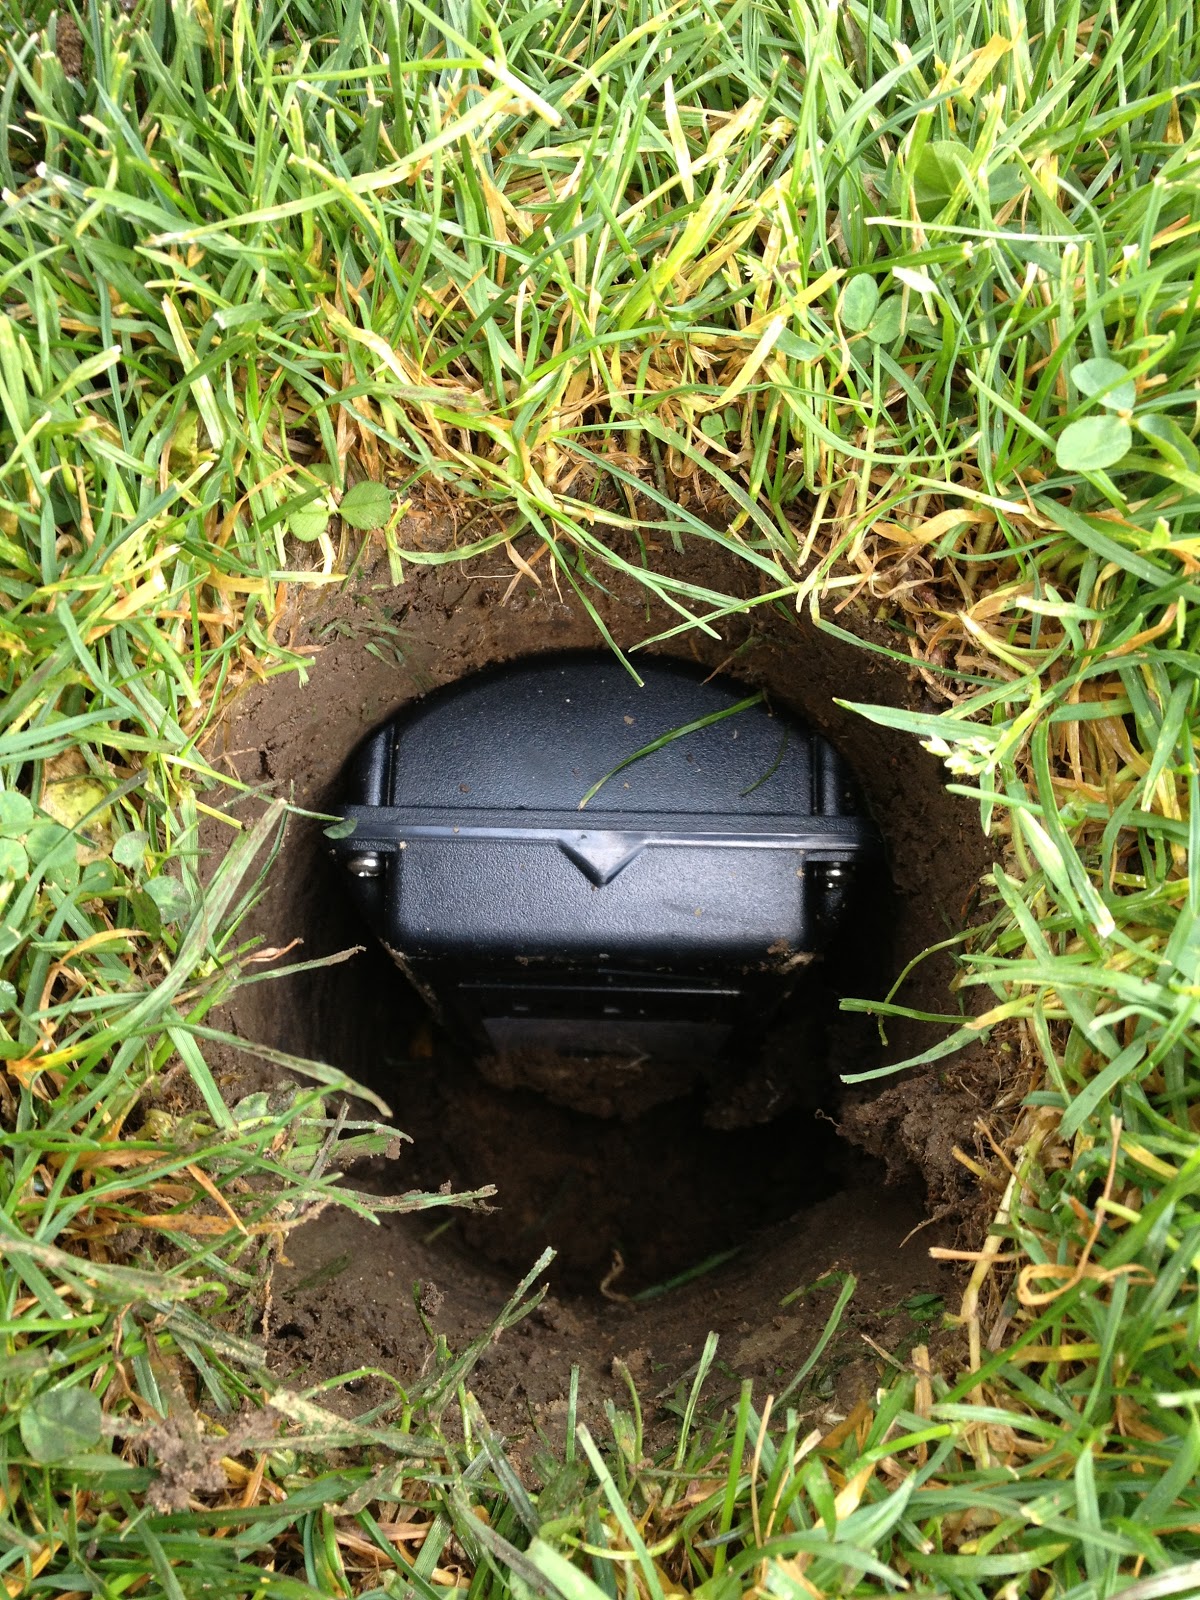
In the picture above you can see the upper set of probes and the lower set of probes. Each probe is responsible for a different reading. The install is pretty easy.  We used a golf course cup cutter to create a clean hole so the sensor can be inserted into undisturbed soil. We chose to place the upper probes at a depth of 2 inches from the top of the soil profile. We recieve readings at 2" and 7" depth in the soil profile.

In the pictures above you can see the sequence of the installation. The cup cutter makes the perfect hole to insert the device into as well as provides us a clean sod plug to put back on top when we are finished. Once the hole is cut to the proper depth to put the top probes at 2" below the soil surface, the probe is then pushed into the side of the hole into the undisturbed soil profile to ensure good tight contact with the soil profile. To make sure we were able to find them we took exact measurements to triangulate the location of each sensor as well as put a large metal washer on the top of the sensor allowing us to use a metal detector to pin-point their exact location.

The real power of the system though is in the data monitoring. I am able to pull up the individual sensors in the field and look closer at the data and determine the profile situation.
In this graph you see two colors, these represent two different sensors. Both of these sensors were placed on Franklin Field. The yellow line is the center of the field where we have decent soil and the orange line is the north section of the field where we have major challenges with the soil profile. You can clearly see the top graph shows that on the 16 of October we ran an irrigation cycle.  You can clearly see the spike in the graph representing the applied moisture as it reached the 2" depth. We have always known that the north end of the field holds moisture and does not drain very well at all.  This graph clearly represents our past knowledge from a scientific perspective. You can see that the yellow line is showing the moisture moving through the profile at a quicker rate than the orange line, thus showing the profile drying quicker. Then at the end of the line you can start to see the moisture increase from the rain snow mix we just recieved.

This graph represents two sensors we have deployed on Farrand Field. One sensor(orange) is in the center of the field where we have the Quickdrain drainage system and the other sensor(green) is in the west end of the field outside of the drainage system. Again as we have always known the drainage system works great at allowing moisture to pass through the profile. This shows how much faster the drainage system prevents standing water on the main field portion. You can see a spike on the orange sensor which shows an irrigation cycle we ran on the field, the green represents the non-drainage portion of the field which we did not water because the soil holds moisture and there was not a need to irrigate that portion.

As you know, CU is a very compact campus which provides many challenges. One major challenge is parking on campus, especially during large campus events. The first priority of the recreation fields is to provide a safe playing field for all the rec sports that are played on them.  Secondary uses include events and in some cases parking cars on the fields for even larger events.  During large events there are times when mother nature does not cooperate with event plans.  At those times the decision is made based on in-the-field inspection as well as the Turf Crew's knowledge of what moisture level is safe to allow cars to park on the fields and not damage the fields. Obviously when the decision is made to close parking for an event there are impacts to all facets of the event. This includes dissapointment with not being able to park directly on campus for whatever event you may be attending.  Inevitably there are questions about the necessity of the closure. This new system will help greatly with providing scientific data to help support the Turf Crew's knowledge and experience with the ability of the field to handle each specific type of event and if the field condition is right for the type of usage.

Recently there was a need to close the field for parking for an event. In the top picture you can see that our soil moisture level was at 46.6% at the time parking was supposed to begin. The biggest challenge for the turf crew is not evaluating the field for foot traffic, that is easy.  The real challenge comes with knowing that vehicles can greatly vary in weight compaired to human traffic and you could have vehicles weighing from 2,000lbs to large SUV's weighing up to 6-7,000lbs.  This will dramatically increase the need for the soil profile to be at the proper moisture level to be able to resist these kind of forces without altering the grade of the field.  In the second picture above you can see the field soil moisture was much lower 37.09% at the time for another field parking event.  That may not seem like much of a drop in percentage but the field condition was much improved and we were able to allow parking for an event on that day.  The field was noticeably dryer but it was still not in the ideal condition.  But that is where the human factor plays the biggest roll in the decision, for the turf staff to know, from years of experience with field parking, what the "feel" under the foot is makes a huge difference.  Just relying on the data is not enough for these decisions.  Remember that the moisture reading is from 2" below the surface and depending on the recent temperatures you could still have the surface of the soil very soft, but if it has been warm and dry the surface could be acceptable for parking.

This is going to be a great tool in the tool bag to help support the knowledge and decison of the turf staff with scientific data. As we have these systems longer we will continue to learn what a % moisture content truly is like in the field and this will help us to gauge the proper uses of the field and what damage is received from the different types of events at that moisture level.

Finally, this graph represents a sensor we have on Benson Field. What is really interesting is the data helps to show that our "in the field" decisions of when to water have been pretty close. If you notice the "dry down" level is very close to when we then make an irrigaiton application in each instance of watering. This time of year, as we are stretching water for root developement, we are averaging every 5-7 days for a cycle. What is interesting is we have started testing the limits a bit with our "dry down". You can see in the graph where we let the moisture level drop much further than the previous times we would make an application. The part we are trying to learn is based on our root structure, how low on soil moisture can we go before the turf starts to stress. You can see we stretched the moisture level out  futher and found that in this location we can go longer than we thought based on visual determination. As you can see we threw a large amount of water to replenish from the dry down.

We will continue to deploy more sensors as funds become available and continue to refine our irrigation practices even further with the use of this new tool.

Ryan
 

Thursday, August 9, 2012

Pump Log 2000

A constant challenge for Turfgrass professionals has, and will always be irrigation. It is the most crucial of all agronomic techniques especially during times of drought and high temperatures. There have been many advances over the years to increase the efficiency of the irrigation application; sprinkler heads are more precise in their applications, central control systems have become even more advanced, and many great tools now exist to help with "site specific" irrigation needs.

The pump station is something that over the past 10 years has become a focus for irrigation companies. They have worked to incorporate technologies that make for better energy efficiency, flow management and operational safeties. These features help to assure that the station will stay operational at the most crucial of times.

To make an irrigation application, you need two components. One is the central control system computer, and the second is the pump station. The control system is where you control what stations are going to run and for how long, while the pump station actually delivers the water to the sprinklers and ultimately to the landscape.  Traditionally these two components have operated independently of each other. There have been a couple of programs that work to connect these two systems so that they act together to provide a more comprehensive operation. Flowtronex Pump Log 2000 is one of those programs. Recently, through advances in radio technology, I have been able to link these two systems by bringing Pump Log to CU!


These two pictures show the pump log interface that I'm able to see on the Toro Sitepro computer. One of the biggest stress points turf managers have is worrying whether the pump stations are still online and running smooth, especially at times when we are not around to physically check on them. There are many times in the middle of the night during hot stretches of weather where I wake up wondering whether everything is watering O.K. and if the systems are all online and working properly. The old method was to drive in during weekends or late at night to verify everything is working properly. With this new system I'm able to check on the stations from anywhere by dialing into the system and looking at the Pump Log program. This has been a great help especially during this hot summer.

One other benefit to the system is the datalog capabilities of Pump Log. When you have a central control system you are able to input data specific to each sprinkler zone to help the computer manage the Gallons Per Minute properly. This insures that the system pressure is always at the desired point. In the past when you felt like you may have flow problems, you needed to sit in the pump house during the entire night, watching the screen to see your pressures and flows, and then pin point a time when the program may not be functioning properly. Obviously this was a time consuming process, not to mention a tiring one.


In the above pictures you can basically see two different graphs. The top graph is the amount of water that the Network 8000 (central control system computer) thinks is running, while the bottom graph is the amount of water that the pump station is actually pumping. This is a gold mine of information for turfguys like myself. I'm able to glean massive amounts of information from this data; specifically how my irrigation system pressures look through the entire irrigation cycle and also what gallons per minute are flowing.

As you can see the graphs are very similar on the surface, but when I look deeper into what is really going on there is a descrepancy between what the computer thinks is flowing and what is actually happening.

Based on this type of information I felt we needed to complete a full campus audit of every single sprinkler zone on the entire campus. This summer we have had two student employees working on this audit. They go to every single station on campus with a print out of every single station from the Network 8000 computer. The Network 8000 has a "control system" where all kinds of information is stored. I spoke about the Network 8000 computer control system in this post from a little while ago. In the control system, large amounts of data are input such as type of head, type of nozzle in that head, number of heads, etc. This data is very important, as with all computers they only know what you tell them. Therefore if the data is incorrect it can cause problems through the whole system. The staff will go to every single station, turn it on, and then compare what is in the computer with what is actually in the field. We have found some pretty significant differences which once repaired will help the entire system function better.

We have recently finished the west main part of campus and I have input the data into the system. I have not gone live with this new information yet as I have been testing it to make sure everything is still functioning properly and that no additional problems were caused when the data was changed.

Currently I have Pump Log up and running on the two pump stations on main campus and am working through some challenges before the new Williams Village station goes online. So far the system already worked in our favor a couple of weekends during this summer, as we were able to see that we had a problem and could respond to rectify the situation. This prevented the station from being down all weekend long.

I can't tell you how nice it is to be able to have this technology. The middle-of-the-night cold sweats are no more!! :-)

Ryan

Sunday, August 5, 2012

Little Tricks

First of all to all who follow this blog I apologize for not posting in a while. As you well know this year has been one of our biggest construction years in a very long time. We have been extremely busy with construction and it has taken all of my focus for many months now. Also with the extremely dry spring and early summer we have been up and running at full speed for many months. But the final push is close, only a few weeks left until fall semester begins and there will be many long days trying to get the place ready for fall semester.

But now that we have gotten things under control I wanted to get back to providing information and writing some posts. Hope you enjoy.

As I have talked about in past posts, construction during the summer is one of our biggest triumphs and challenges. There are only a few months where the campus is relatively quiet and this allows for a whole years worth of work to try and be accomplished in just a few short months. One of the challenges we are consistantly faced with is maintaining the campus landscape while construction is impacting the irrigation system.

Over the years we have come up with many creative ways to continue irrigation operations outside of construction sites while the vital portions of the irrigation system are actually in the construction zone.

There are two main pieces of the irrigation system that, depending on the location of construction, need to be maintained through the construction zone those would be the mainline and the control wires. At the Recreation Center renovation we have a situation where we have had to make drastic accomodations to keep things running. In the pictures above you see a fire hose and control wires.

The fire hose is acting as the mainline through the construction site. What happens is at the beginning of the day the contractor shuts off two new gate valves and un-hooks the fire hose. They then roll it up and move it out of the way. Then at the end of the day they hook the fire hose back up and turn the gate valves back on and re-pressurize the system.
We have used many little tricks like this to keep things going. We have hung mainlines from I-Beam supports before but we have does the "By-Pass" trick many many times. This allows the contractor to remove a risk from their jobsite and insure that they dont have mainline breaks which can slow the whole project down and cost money at time.


The controls wires, on the other hand, are a different story. With the fire hose it is very easy to shut it down and un-hook it becase there is no sequencing or anything, it is basically a simple task that for the most part can't be done wrong. With the control wires though if they were to have to cut them each day and move them out of the way it would be a time consuming task and wires could possibly get mixed up or not hooked up correctly each day. Since each of these wires is associated with a specific sprinkler zone it is crucial to make sure and keep the proper wire sequencing or risk un-intended operation of the sprinkler stations.

This is where we have to sometimes take the wires and re-route them completely around the construction area into a "safe zone" that is away from vehicle and construction traffic. It is a very time consuming task but once it is done it wont need to be adjusted until the new mainlines and irrigation are installed in the later stages of the project.
As you can see with some of the pictures we have taken the control wires up and around the work site and they are very safe at this time. unfortunately it is not the cleanest looking adjustment but as a former boss used to always say to me, "you have to crack some eggs to make and omelette!"

This kind of "work-around" is very common here on campus. We have a very dense campus and there are a lot of utilities. Every contractor has to work very hard with the campus to help make sure the core functions of the campus remain while working to improve the campus as a whole.

The best way to look at situations like this is to have an open mind and think outside of the box! If you focus too hard on "normal" methods you will have a tough time achieving the end goal of the university, which is to provide a great environment to help our student population have the best chance to succeed in higher learning.

Ryan